Pre = Pretreatment, LLL = Lost Land Lake, TL = Teal Lake, HAT = Hours After Treatment, DAT = Days After Treatment, Y = Sample
Samples were collected by QLIA volunteers and shipped to EPL Bio Analytical Services for analysis.
Results
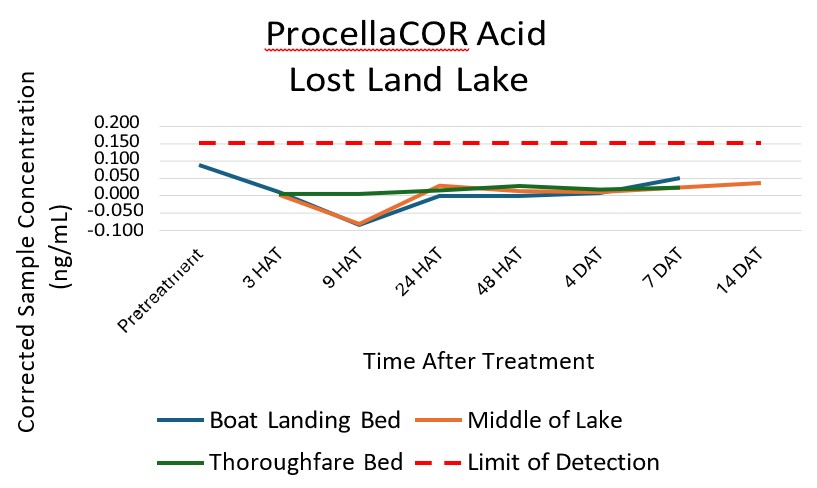
The following data has been summarized from the EPL laboratory results. The lab analyzes ProcellaCOR (florpyrauxifen-benzyl) by measuring the amount in the sample as well as the florpyrauxifen-benzyl acid, which is the next component that ProcellaCOR is broken down into. The limit of detection (the lowest concentration of a substance in a sample that can be consistently detected with a certain level of certainty, typically 95%) for ProcellaCOR is 0.06ng/mL and 0.15ng/mL for the ProcellaCOR metabolite acid.
Lost Land Lake
TABLE-7. LOST LAND LAKE PROCELLACOR CORRECTED SAMPLE CONCENTRATION (NG/ML)
Time After Treatment
Boat Landing Bed
Middle of Lake
Thoroughfare Bed
Pretreatment
0.0159*
3 HAT
0.3310
0.0000*
0.1430
9 HAT
-0.0023*
-0.0091*
0.0204*
24 HAT
-0.00907*
0.0929
0.0589*
48 HAT
0.00453*
0.0295*
0.0113*
4 DAT
-0.00227*
0.00453*
0.0272*
7 DAT
-0.00680*
-0.0136*
0.00*
14 DAT
0.00453*
*indicates lower than the limit of detection
FIGURE 14. LOST LAND LAKE PROCELLACOR ACID CONCENTRATIONS
FIGURE 13. LOST LAND LAKE PROCELLACOR AND PROCELLACOR ACID CONCENTRATIONS